

This is the second in a series of posts that explore the rigorous process of building NABP’s examinations. Here we explain the creation of the new NAPLEX candidate performance report.
The Value of Subscores
Before we describe our process of creating our new NAPLEX candidate performance report, it is important to discuss exactly how the competency area scores are created and how they should be interpreted.
The NAPLEX is a unidimensional test, meaning that it is designed to measure a single construct of general pharmacy practice knowledge. Therefore, any subset of items taken from the whole group of items on the test is simply a less precise measure of that construct. Subscores are typically based on a small number of items, in our case as few as 14, and are not reliable enough or distinct enough from the rest of the test to justify separate reporting.
It would be extremely rare for any subset of items to significantly differ from a candidate’s overall score. However, we understand that many believe subscore feedback could be a valuable tool for candidates who do not pass the exam. It is for this reason that we developed our new performance report, to serve as a NAPLEX study guide for those candidates who need to retake the exam.
How We Created Our New Performance Report
Given that NAPLEX is a Pass/Fail exam, it only makes sense to use the passing standard as our starting point. The passing standard of 75 was set following the review of a standard-setting exercise conducted in July 2020.
Next, we determined that the average standard error for a subscore was between 10 and 20 scaled score points. Obviously, the largest competency area has a more precise score (i.e. smaller standard error) than the smallest competency area, as there are more questions associated with calculating that competency area score. However, for our purposes, we simply took the group average and decided that an estimate of 15 points would suffice. Two standard errors is roughly equivalent to two standard deviations in a population, so we added and subtracted two standard errors (30 points) to our passing standard of 75 to determine our classification or scoring boundaries. This gave us boundaries of 45 and 105 along our score scale. After some deliberation, we decided to round the values to 50 and 100, giving us our final thresholds of 50, 75, and 100.
Performance Level Descriptors
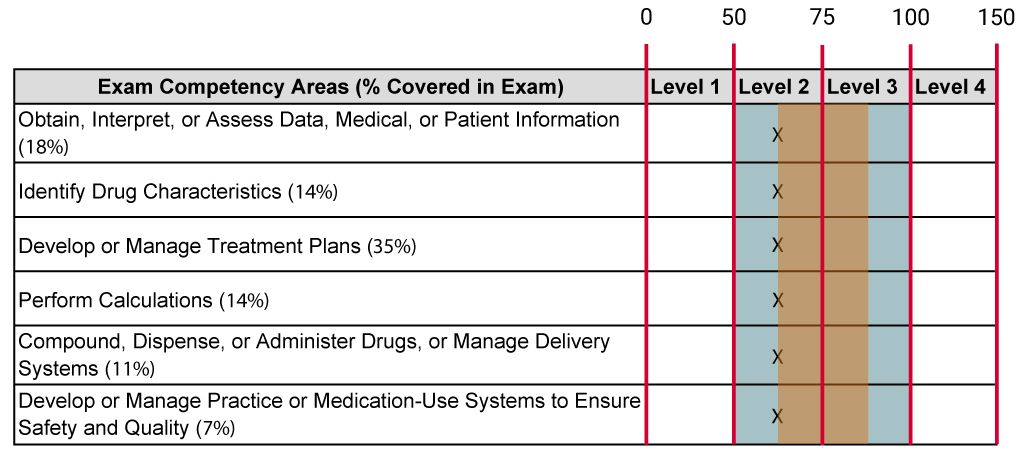
These three threshold values gave us four categories. The lowest level (Level 1) is assigned for scores between 0-49, so we deemed that performance at this level is far below meeting the minimum performance necessary to demonstrate competency. Level 2 is the score range just below the passing standard, so it was determined that performance at this level does NOT meet the minimum performance necessary to demonstrate competency. As Level 3 begins at the passing standard, we determined that performance at this level meets the minimum necessary to demonstrate competency. Finally, Level 4 describes the highest portion of the score scale, so performance at this level exceeds the minimum necessary to demonstrate competency.
These final thresholds are shown on the chart alongside the competency areas to provide an illustration of the achievement level descriptors to the NAPLEX score scale.
Future research is planned to investigate the efficacy of these four levels and to refine them to make them more useful to candidates.


